Engineering Stress
What this is
The following sections below provide a (sometimes silly) introduction to what Engineering Stress is, why it's important, how it's calculated and visualized, and an interactive tool to show how stress is created under various loads.
Who it's for
While the analogies and explanations are made to be easy to understand, some descriptions do end up getting into the weeds where having a base understanding of the following is helpful: Algebra, Forces, Moments, Reactions, Area, Area Moment of Inertia, Basic Statics, and maybe an affinity for bears.
Why it's here
This page is intended as a resource for introductory engineering courses such as Mechanics of Materials, where terms like "Stress" are first introduced. The tool can also be used as an aid to those textbook problems that involve basic 3D cantilever beams, helping to visualize and show the calculation processes a student must go through to solve them.
Getting Started
What is Stress?
Engineering Stress can be a difficult concept to grasp and explain, even to those who get to deal with it regularly. Many units of measure are easy to see, understand, and compare: a friendly bear is much taller than you, weighs much more, and can run much faster than you[*]Bear: 3. You: 0. But the tree branch you and the bear are both hanging from is also undergoing stress[*]Slightly different than the stress you may be experiencing which may not be readily visible…until it breaks!

|
||
Height |
Weight |
Speed |
Why It's Important
As engineers, we are tasked with designing and building objects that perform the use they are intended for and are safe for the person using them. So, when designing everyday objects like a bridge over troubled waters, a staircase to heaven, a wonderwall, or a hotel in California, it is imperative that we accurately calculate stresses and choose the right materials and geometries so that they don't break unexpectedly!
So What Is It?
When a force acts on a material, causing it to deform and change shape, the molecules within that material are forcibly moved further apart or closer together. These molecules do not like to be forcibly separated or squished together, and the material will have an internal resistance to the applied load. This is called Stress.
The amount that a material expands relative to its original size is called Engineering Strain. Strain is related to Stress by a material property, as will be discussed in the next section. But Engineering Stress can be calculated using only two inputs:
Whether or not the material will break under a certain amount of stress depends on the type of material, and more specifically, how well that material resists getting bent, pulled, compressed, or twisted.
The Stress-Strain Diagram
Young's Modulus of Elasticity
Stress and strain are directly proportional to each other by a factor called Young’s Modulus of Elasticity which is a property of the material itself. Young's Modulus is basically a measure of how stiff a material is. Materials with a larger Young's Modulus are capable of handling higher levels of stress before they deform irreparably. In the Stress-Strain Diagram show below, Young's Modulus is the slope of the straight part of the graph. The steeper the slope, the more stress a material can handle with lower strain (i.e. less "stretchy").
 Straight-Line Section: Good. Curvy Section: Bad. X-Section: Really Bad.") Stress-Strain Diagram
Stress-Strain Diagram
Elastic Deformation
If only pulled apart slightly and then released, then the molecules will return to exactly the same place they started, in their normal unstressed state. This is called an elastic deformation. One way to think about this is to consider your favorite pair of pants. They fit perfectly, right? Have too many tacos one night[*]A quality excuse, and they may stretch a little bit and be a little more snug, but they will return to their normal size afterwards. However, lend them to a larger friend and they may not come back in the same condition they were borrowed, as they've been "over-stretched".[*]Probably just let your friend have them at that point This happens with other materials too.
Plastic Deformation and Fracture
Forcibly stretch a material too far apart and the material can be damaged, often by elongating. This is called plastic deformation and is represented by the rounded part of the graph above. The point at the end of the graph represents when a material's molecules are pulled so far apart that the material will fracture and break into separate pieces, the equivalent to loaning your favorite pair of pants to an elephant.[*](Not recommended)
Calculating Stress
How to Calculate Stress
Though the term may be intangible, Stress is relatively straightforward to calculate using knowledge of the two qualities mentioned above: how much force is applied to a material and the object's geometry (it doesn't depend on the type of material!). The calculation is made even easier because firstly, there are only two types of stress (normal and shear) and secondly, Engineering Stress is additive in nature. All of the stress in a single location of the same kind can be added together, no matter the source of that stress (bending, twisting, bears, etc.).
Normal and Shear Stress
As mentioned above, the two main types of Engineering Stress are Normal Stress (denoted by sigma, σ) and Shear Stress (denoted by tau, τ). To help us understand these, we're going to revisit our friendly bear. Unfortunately, he got into some very sticky honey and can no longer separate his two paws from each other. Here the honey represents the resistance to change that the molecules in a material also experience, aka "Stress". If he tries to pull his paws apart directly away from each other, the sticky honey will resist his attempts to escape. If he pushes his paws together, there will be honey in the way and the honey will squish. Both these two applied forces create Normal Stress in the honey, with "pulling" or tensile stress commonly considered positive (+) and "squishing" or compressive stress commonly considered negative (-). After these two unsuccessful attempts at honey freedom, our bear friend may try to slide his two paws apart, side to side in a rubbing motion. Again, the honey will resist, this time creating Shear Stress in the honey.[*]Don't worry, he eventually licked his way to freedom.
Bear Stresses using Paws (TBD)
(Some of) The Equations
To the right are four examples of stress that appear often, as well as their general equations using the applied forces and geometries. In these equations, variables based on the applied load are colored red, while variables based on object geometries are colored in blue.
However, as usual with all things simplified for physics, there are a few caveats and exceptions to the equations worth mentioning:
Firstly, it is important to note how the stress changes depending on what point on the cross-sectional area you are investigating, except for the case of axial loading because of symmetry. While a beam in bending has the highest stresses at the top and bottom of the beam, shear stress due to beam shear is just the opposite and has maximum stress at the central axis for vertically symmetrical faces, and zero at the top and bottom of the beam.
Secondly, to successfully use these equations to solve basic three-dimensional beam problems like the tool on this page does, the user must picture how these equations are applicable in other directions. If a sideways force is being applied to the end of the beam, there will be beam bending in a side-to-side direction (instead of up and down), as well as horizontal beam shear, and the cross-sectional heights and widths used to make stress calculations are switched.
Thirdly, it should be stressed that calculating normal and shear stress requires a bit more grunt work as the cross-sections of the beams become more complicated, often referring to tables or performing integrals to calculate Area Moment of Inertia (I), or the Polar Moment of Inertia (J). Finding the Polar Moment of Inertia, even for a simple rectangular cross-section is a bit too complicated to go into here, and is purposefully omitted. To calculate shear stress due to beam shear, the equations to find the stress at any point are actually as shown below, but it is often easier and more useful to look at the maximum stress. Luckily, plugging in values for the neutral axis where the stress is greatest results in the simplified equations to the right.[*]#yay

Finally, there are a couple other ways that stress can be induced in an object that can't be well-explained with the simple beam model used in the tool below, such as pressure vessels, fatigue, and stress due to thermal expansion, which are left as exercises to the reader.[*]Please be careful while writing stress equations and running simultaneously.
 Equations") Stress Equations
Stress Equations
Now that we know how to calculate different types of stress, we have to keep track of which stresses are Normal or Shear, which surfaces they apply to, and which direction they are in.
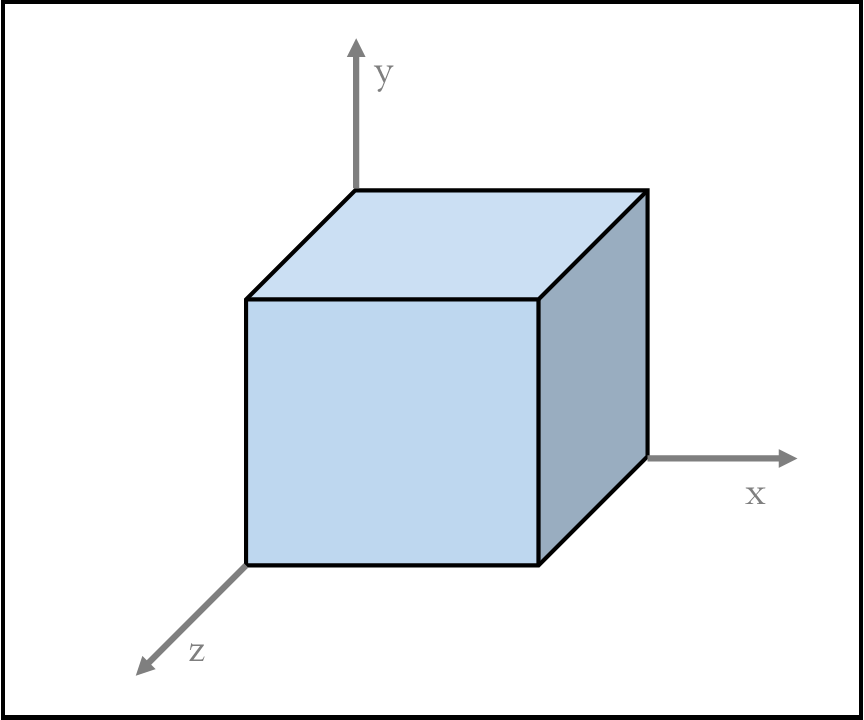
Representative Stress Cube
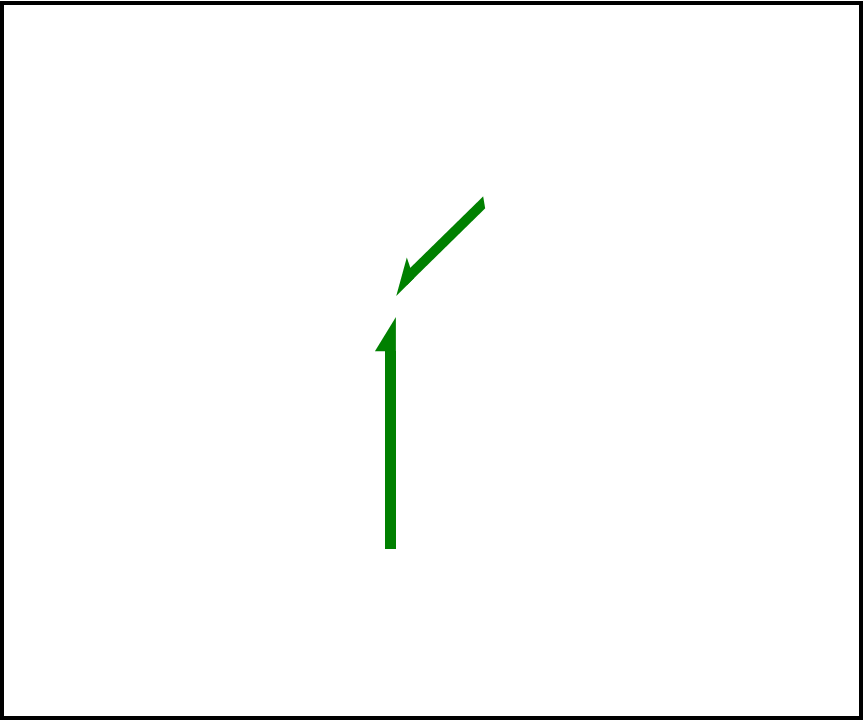
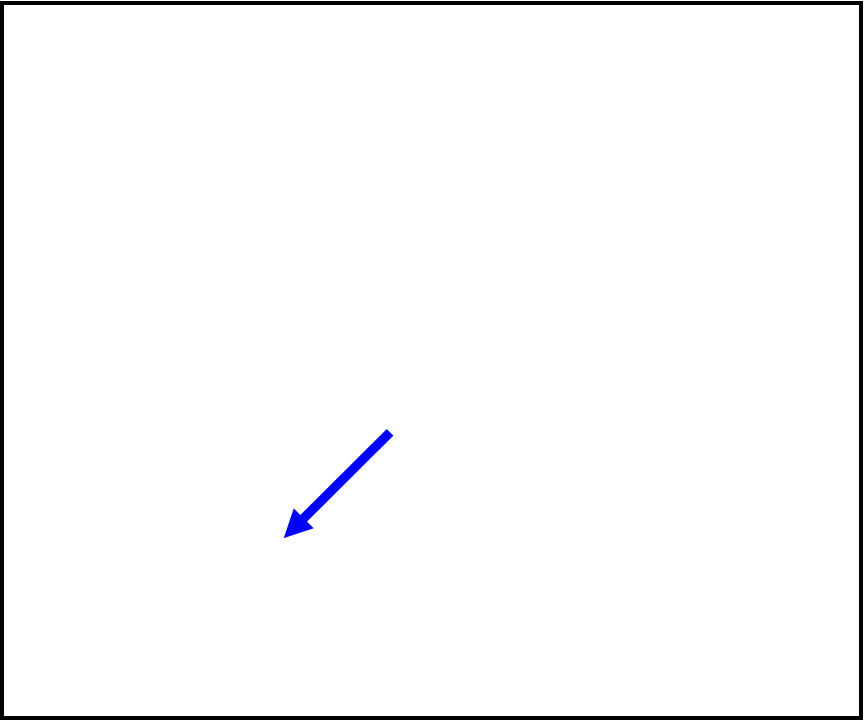
To help with the difficulties of keeping track of normal and shear stresses, and which stresses can and cannot be added together, a representative cube with infinitesimally small sides is used as a visual aid at the location of interest (remember that the top of a beam's cross-section may have very different stresses than the center or neutral-axis!). Each face of the cube has normal stresses (stresses perpendicular to each face) which represent the material being compressed or pulled apart, and shear stresses (stresses along the surface) which can be imagined as the material sliding against itself with friction between the two surfaces (bear paws sliding across each other). From a side view, those shear stresses make it look like someone is pulling two opposite corners of a square piece of fabric apart so that it takes on a more diamond-like shape.
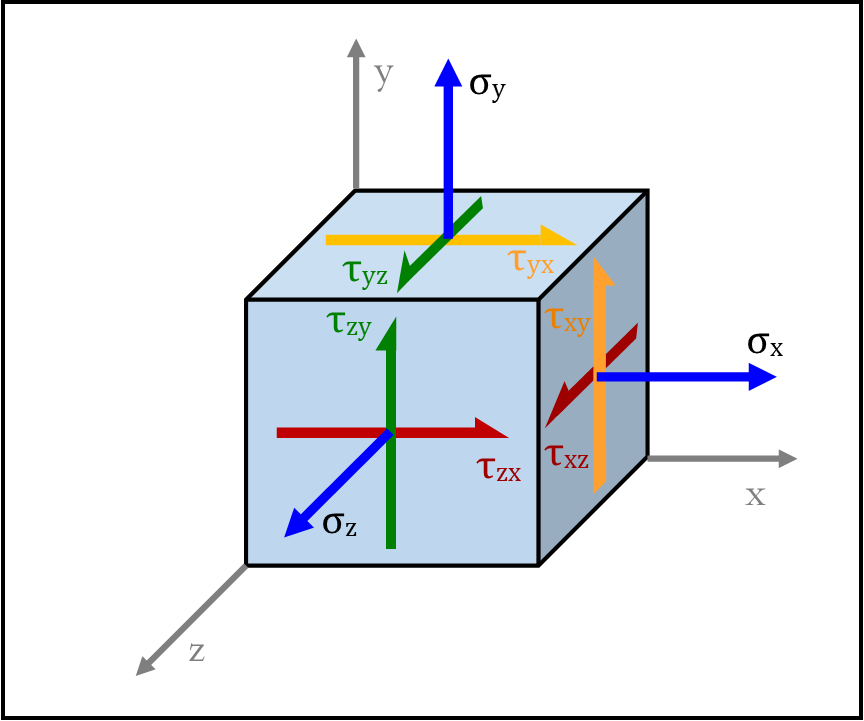 Representative Cube Stresses
Stress Cube Equilibrium
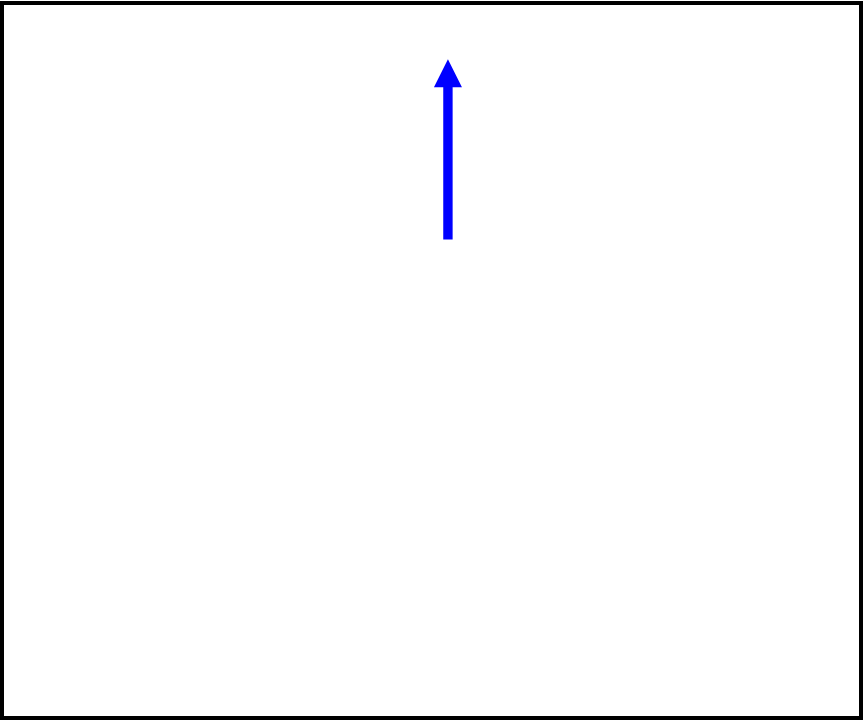
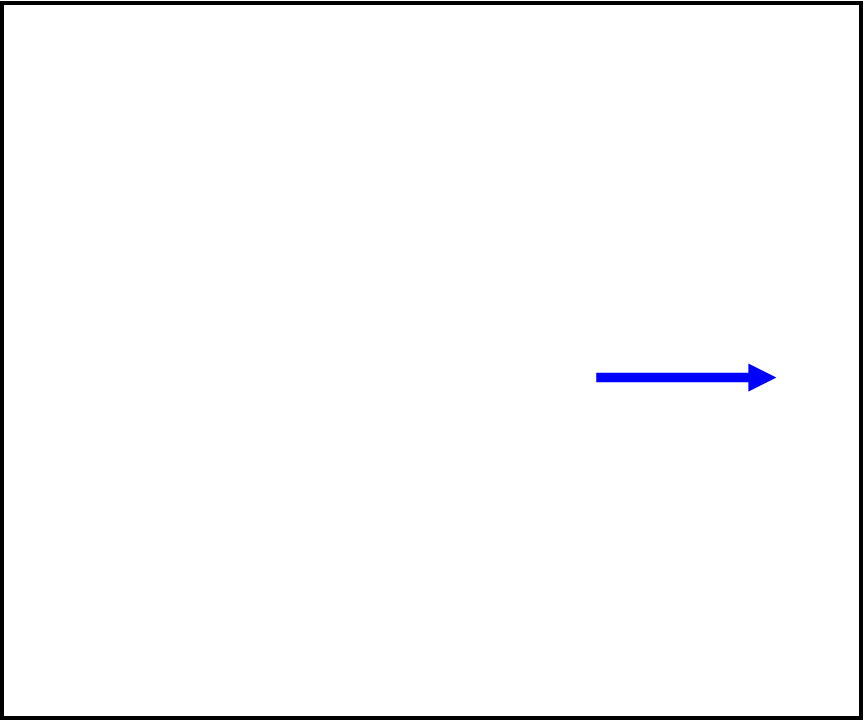
As Newton’s Third law has taught us, for every action there is an equal and opposite reaction. Assuming the material in question is not in motion, for each stress applied to this cube in one direction, there is an equal stress in the opposite direction. While it is a bit of misnomer to say that a "stress is pulling", these stresses can be thought of as a Force over an Area. Since the area of one face of our stress cube is the same area as the opposite face (both are infinitesimally small), we are allowed to think of them in the same way we think of forces maintaining equilibrium. For Normal stresses, this means the top and bottom face stresses are "pulling" up and down respectively with the same quantity. Likewise, the front and back, and left and right stresses "pull" in equal but opposite directions from each other.
 Cube Equalized with Normal Stresses
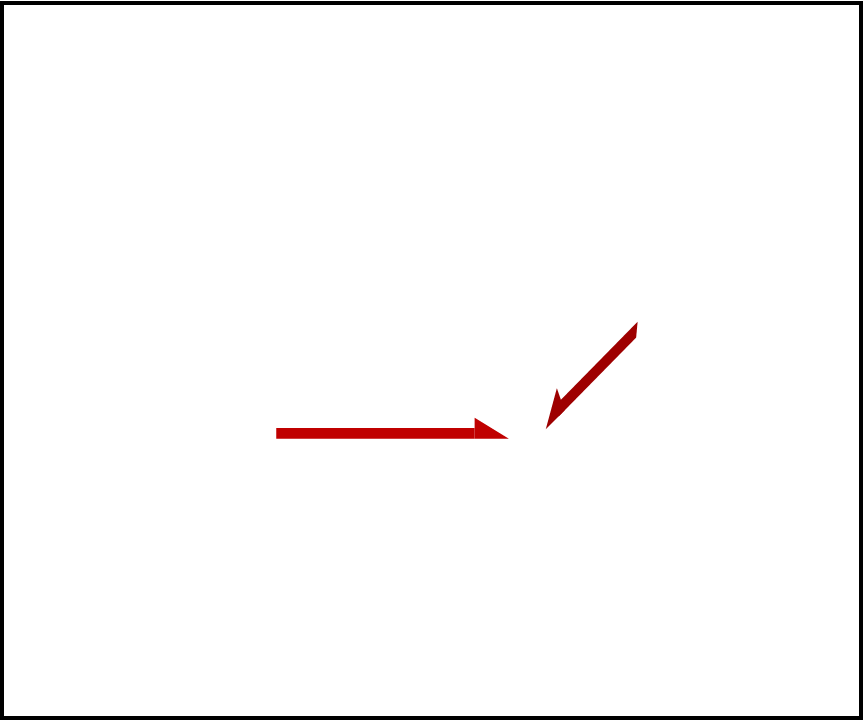
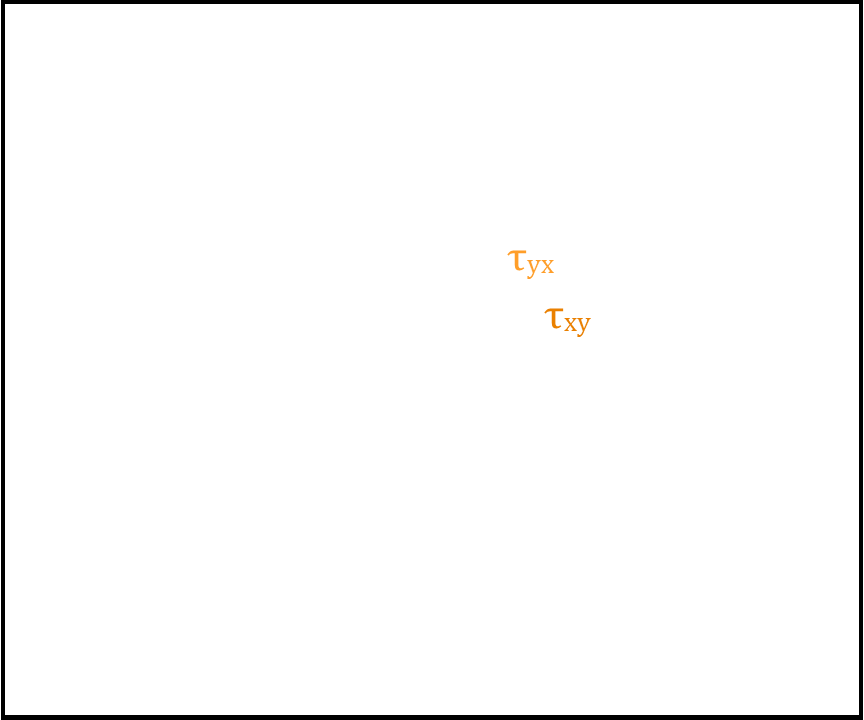
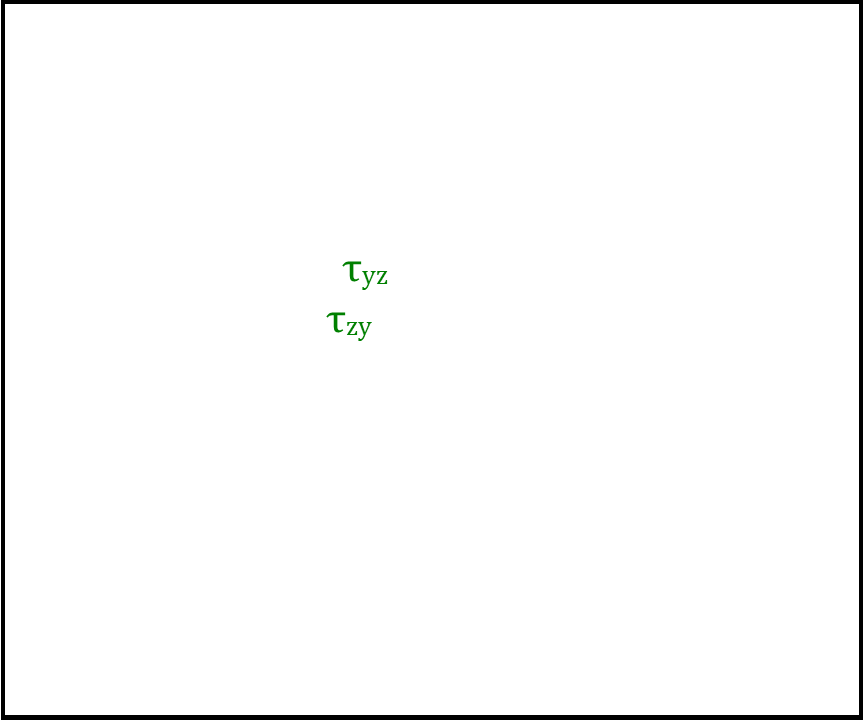
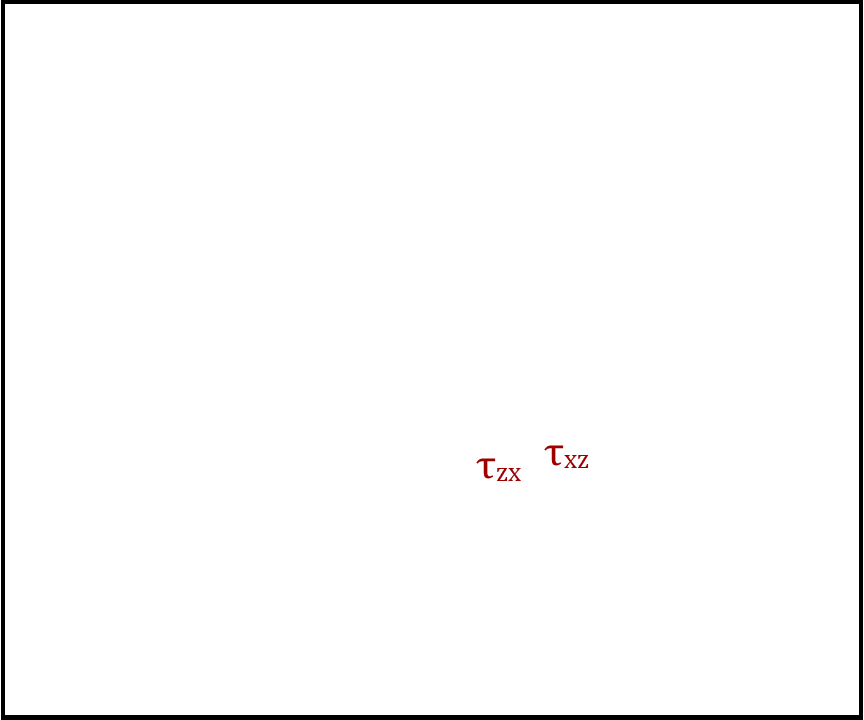
The Shear stresses are the same, just harder to visualize. If there's stress sliding across one surface, then there must also be a stress on the opposite side of the cube in the opposite direction. If you just have these two opposing stresses, then the cube would spin - it would not be in equilibrium. Therefore another pair of stresses appear on the two connecting faces, to balance this out.
 Cube Equalized with Shear Stresses
Since the backside of the cube is both hard to see, and easy to infer what the reaction stresses look like based on the front three sides of the cube, the stresses are often left off for visual's sake, and assumed present to maintain equilibrium.
Stress Visualization
Picture This
One way to visualize stress is through color. You may have heard of "Finite Element Analysis" before and seen pictures like the one below that highlight a stressed area versus non-stressed area. Obviously these colors do not appear in real life as stresses are induced. However, these are great tools to see where an applied load on a specific geometry can cause high stresses in the structures. This colorful, comparative representation is extraordinarily useful for designers since it allows them to adjust (or completely redesign) the geometry of a structure and try again to see if the stress is lower. They can then iterate on this process, making adjustments over and over again until they are certain the structure is safe to build. However, those tools are expensive to use, require a lot of fine adjustments to get an accurate model, and can take a lot of time to compile. Being able to do quick, back-of-the-napkin[*]Clean napkins preferred - we said "Strain" not "Stain" calculations and having a good idea where high stress points may occur can save a lot of time and energy!
 Wing FEA Model
In pictures like the wing above, the different types of stress are not usually differentiated between normal stress and shear stress. By sneakily changing our frame of reference using a nifty mathematical tool called "Mohr's Circle"[*]Originally called "S'Mores Circle", but engineers kept getting too hungry for sweets during their all-nighters, so the "S" was removed., we can find what are called principal stresses, which tell us a lot more about whether a material can withstand the stress being created in it.
Principal Stress
To understand principal stresses we are going to visit our bear friend one last time.[*]Fur old time's sake This time he is feeling very talkative and decides to say ‘hello’, which he does by roaring very loudly. You and your friend are both standing 50 feet away from the bear, but neither of you are right in front of him (understandably), so it's not as loud of a sound. The roar would appear much louder if you were directly in the path of his presumably friendly greetings. Assuming you don’t want to stand directly in front of the bear but you still want to know how loud the roar is over there, you could measure how loud he is (perceived magnitude) and how far away from him / in what direction you are (geometry) and use some physics magic (i.e. Mohr’s circle) to calculate the maximum loudness of the roar. Note that his roar doesn't actually change in volume, you just happened to be standing in the wrong (or right) spot to keep your eardrums intact and not get slobbered on.[*]Or eaten.
 Bear Hello's and Principal Stresses
So it is with stress! The amount of stress we calculated using the formulas above is similar to what we happen to hear when we're standing off to the side of the bear. But to truly hear his "Good Morning!", i.e. find the principal stresses, we'd have to change our reference point. By figuratively rotating our representative cube, the normal and shear stresses will vary. At a certain point by rotating to juuuust the right angle, the Normal Stresses will be highest (principal), and the Shear Stresses will be lowest. At an angle of exactly 45 degrees to this, the Shear Stresses will be highest, and the Normal Stresses will be lowest. Depending on which one of these principal stresses is greater, it is at one of these two angles that the material would most likely break.[*]COOL RIGHT‽
Using Mohr's Circle as described above and comparing that maximum stress value to the material's Yield Strength or Ultimate Tensile Strength will inform whether or not a material will be irreparably deformed or break under that stress. This is why designers and engineers generally focus on the maximum stress value instead of separating out Normal and Shear Stresses when they're analyzing a geometry to see if it will break under a certain load.
But unfortunately for us, our bear friend is tired of teaching us engineering concepts and has gone back to his bear family[*]Maybe he'll be right back, and just needed a quick paws., and the remaining details of using Mohr's Circle will have to be covered another time by another bear.
Stress Tool
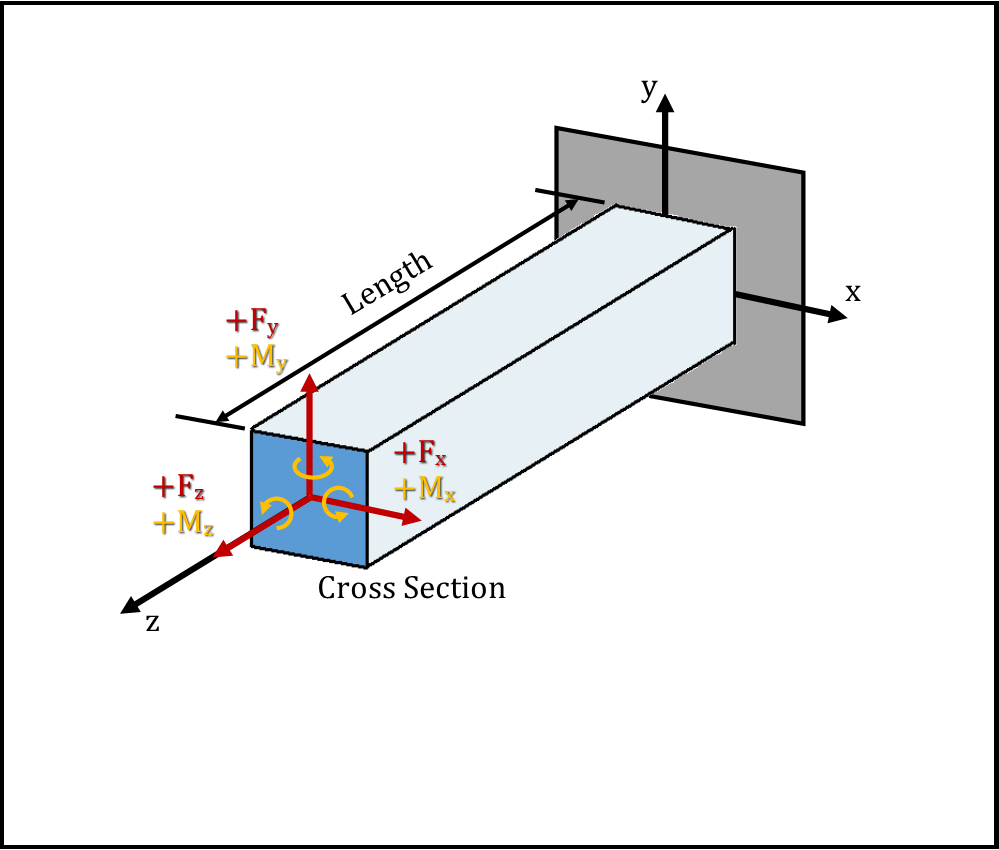
Cantilever Beams
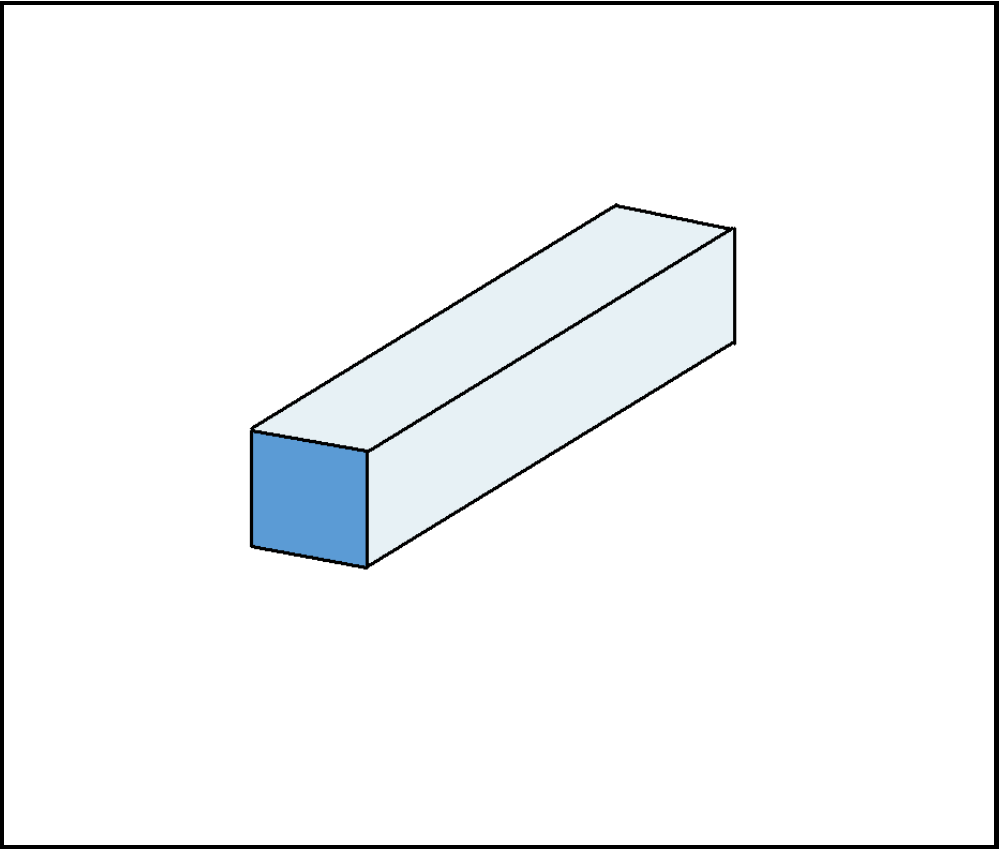
A cantilever beam is a long thin piece (usually the height and width is less than 10% of the length) that is fully supported at one side; the wall provides reaction moments and forces in all directions. Cantilevered beams are often used in engineering problems as they can be easily added together and analyzed to represent all sorts of complex structures from bridges to airplane wings.
Using this Tool
Start by changing various forces and moments to see how the beam reacts! A side with green on it represents "Tension" and a side with red represents "Compression." See which forces and moments update the stresses in the "Stress Results" box. Why do some forces and moments not show up on the representative cube (located at the yellow dot on the beam)? Do some forces cause a bigger stress than others? Why is that? What if the location of the yellow dot was on the side of the beam instead of on top?
Material and Geometry
Beam Dimensions
Beam Visual
Cube Visual


Stress Results
| Normal Stresses in Z (σz) | Due to Axial Force (Fz) | 0.00 Pa |
| Due to Moment caused by Fy * L | 0.00 Pa | |
| Due to Mx | 0.00 Pa | |
| Total | 0.00 Pa |
| Shear Stresses (τXZ) | Due to Beam Shear (Fx) | 0.00 Pa |
| Due to Torsion caused by Mz | 0.00 Pa | |
| Total | 0.00 Pa |